Wednesday, 20 January 2021

Reporting on an Azure IaaS VM cost – have I included everything?

We had arranged our Azure subscriptions to have each resource group representing an application so that all resources that belonged to an application are deployed within a resource group. This enabled us make it easier to grant management access rights to resources on per application basis. We were able to do costing reporting easier for each application as we just needed to report at the resource group level which would then include all the resources for the application. Then when we wanted to decommission the application we could just delete the resource group which would delete all the resources related to the application.

Over time, application owners wanted to drill down further with costing and to know the actual cost on a per server basis within the application. By using Azure cost management, you can filter down to the resource level which you can see that I have selected for my resource “dc001 (Microsoft.compute/virtualmachines)” and the cost is around 32p for January 2021.


Now rewind a bit and think how is a VM made up of in Azure such as Server A from above, what components are required at minimum to run Server A? Looking at the diagram below you can see that you have the “Compute” element which refers the size of the VM at the time of running i.e. D2v3. Next you have the “disk/s” where each VM has the OS disk and then any additional data disk you have added for the VM and finally the network card as well as there is potential cost for egress.

If you looked back at my costing diagram above you will see that I have only selected the compute element and have not included any of the disk/s or network card that are associated to the VM. I have selected the other components and you can see there are additional cost associated to the VM when it was not running and these are the disks. The cost is now £2.98 as oppose to just 32p from before because when the VM is not running you still need to pay for the disk themselves. 

After discovering that I could potentially report the costing incorrectly I had to find a solution to be able to report at minimum the three components that built up a VM (Compute, Disk, Network). I turned to using tags to help me label components that built up a VM. I introduced a new tag called “Server” and the value of this tag would be the server name. For each of the resources that was linked to my server “dc001” I added the tag “server” with the value of “dc001”.


As you can see from the chart now I am filtering only by the tag “server” and it has picked up all the resources related to the tag. I don’t need to work out which resources is linked to my VM. You will see the costing is different to the previous chart as I only applied the tagging midway through the month and not at the start. So, it is important to start the tagging early otherwise you will miss some costing if you are using tags as a way to report costing.

I have just shown you how I have tagged some of the core components of a VM in Azure but there could be other elements that you would like to tag such as the snapshots, backups etc which you may want to do show back. Using this way, I have managed to do a more accurate show back cost of a VM as there are other elements such as disk/s which would still cost money even if you weren’t running the server.


Wednesday, 13 January 2021

PowerBi Azure Cost Management exposing Tag values to be used

I wrote an article about exposing tags to be used in PowerBi using the connector “Microsoft Azure Consumption Insights (Beta)” (Using Azure tags in your powerbi reporting). If you recall there is a warning message when you use the connector which states that it is still under development. It seems like there is no development for this connector as it has been in “beta” for a long time. I noticed that there is a new connector called “Azure Cost Management” which I will walk through which seems easier to configure. I googled around and decided to combine all my findings in to one document.

First as we are connecting via our Enterprise agreement, we need to ensure at minimum that we have “Enterprise Administrator (read only)” permissions within the EA portal. Once we have that we should be able login to https://ea.azure.com and see our enrollment number on the top left of the portal which we will need to note down.

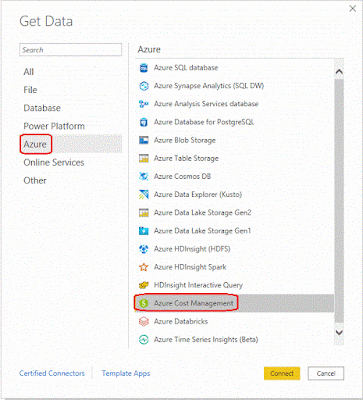
When you start up PowerBi desktop if you get the start-up screen then select “Get data” otherwise on the menu bar select “Get Data > More”. A new window will open up select “Azure” then select “Azure Cost Management” and click “Connect”.

Under “Choose Scope, select “Enrollment Number”, input your enrollment number that we have gathered from earlier step, followed by the number of months we would like to report costing for then click “OK”.

If you haven’t signed in then click on “Sign in”.

If your account is not listed the select “Use another account” and follow the instructions. If your account is listed then select that particular account.

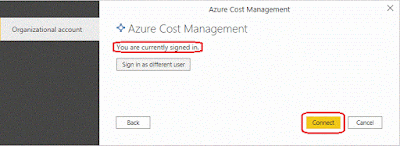
You will be taken back to the sign in screen for Azure Cost Management connector. You should see “You are currently signed in” and click “Connect”

Wait for it to load the tables and we will just select "Usage details" table for now and click "Load"

Once the table has loaded go to the menu bar and select “Transform data > Transform data”

Power query editor should load up. Head to the menu bar and select "Add Column" tab the select "custom column"

A new window will appear to create the new column. Give the new column a name which I have used "CustomTags" (You can name the column whatever you like). In the “Custom column formula” box after the "=" sign enter the following Text.Combine({"{ ", [Tags], " }"}) and click "OK". Please notice the "spaces" and lower/upper cases for the letters as they are important. This formula basically goes to the Tags column and for each row adds the curly brackets to the start and the end of the data so that it is in a JSON format.

The new column will appear at the far right of the table click anywhere on the header and select Transform > JSON

Once that is completed click on the expand icon on the column and wait for the values to load up

Once loaded select the tag names that you wish to expand in to columns to be used for reporting

You should now see the columns you have selected in your table. By default the column name format is <%CustomColumnName%.%TagName%>

On the home menu bar click on “Close and Apply” so that this query is saved. You should now be able to select your new “tag” columns to be used in your reporting.


Going forward I think Microsoft will be doing more development with this connector so it will be best to start using this or migrating to using this.

Azure Resource Support for Availability Zone

Over the years, an increasing number of services are consumed in the cloud and as architects one of the key considerations is designing the ...